Sunday, 13 December 2015

Women can navigate better when given testosterone

Women can navigate better when given testosterone, study finds
Wait… what?

It's long been known that men fare better than women when it comes to performing some spatial recognition tasks such as navigating – although male readers are advised it may not always be prudent to share this information with their female partners (especially when arguing over the best way to get somewhere).

But why is this so? To investigate whether the differences in how men and women navigate are related to our sex or to cultural conditioning, researchers in Norway measured male and female brain activity while volunteers tried to find their way through a virtual reality maze.

Wearing 3D goggles and using a joystick to make their way through an artificial environment, the participants (18 males and 18 females) had their brain functions continuously recorded by an fMRI scanner as they carried out virtual navigation tasks.

In line with previous findings, the men performed better, using shortcuts, orienting themselves more using cardinal directions, and solving 50 percent more tasks than the women in the study.


"Men's sense of direction was more effective," said Carl Pintzka, a neuroscientist at the Norwegian University of Science and Technology (NTNU). "They quite simply got to their destination faster."

One of the reasons for this is because of the difference in how men and women use their brains when we're finding our way around. According to the researchers, men use the hippocampus more, whereas women place greater reliance on their brains' frontal areas.

"That's in sync with the fact that the hippocampus is necessary to make use of cardinal directions," said Pintzka. "[M]en usually go in the general direction where [their destination is] located. Women usually orient themselves along a route to get there."

Generally, the cardinal approach is more efficient, as it depends less on where you start.

But women's brains make them better at finding objects locally, the researchers say. "In ancient times, men were hunters and women were gatherers. Therefore, our brains probably evolved differently," said Pintzka. "In simple terms, women are faster at finding things in the house, and men are faster at finding the house."

What was most remarkable about the study was what happened when the researchers gave women a drop of testosterone to see how it affected their ability to navigate the virtual maze. In a separate experiment, 21 women received a drop of testosterone under their tongues, while 21 got a placebo.

The researchers found that the women receiving testosterone showed improved knowledge of the layout of the maze, and relied on their hippocampus more to find their way around. Having said that, these hormone-derived benefits didn't enable them to solve more maze tasks in the exercise.

It's worth bearing in mind that the study used a fairly small sample size in both of the experiments carried out, so the findings need to be read in light of that. Nonetheless, the scientists believe their paper, which is published in Behavioural Brain Research, will help us to better understand the different ways male and female brains work, which could assist in the fight against diseases such as Alzheimer's.

"Almost all brain-related diseases are different in men and women, either in the number of affected individuals or in severity," said Pintzka. "Therefore, something is likely protecting or harming people of one sex. Since we know that twice as many women as men are diagnosed with Alzheimer's disease, there might be something related to sex hormones that is harmful."

Friday, 11 December 2015

Pain killer ibuprofen now in Patch

New Ibuprofen Patch Offers Consistent Pain Relief For Up To 12 Hours
Ibuprofen is the go-to medicine for many people looking to relieve pain. For some of these people, however, swallowing the little orange pills is a dreaded task. Working in collaboration with Medherant, a bioadhesives company, researchers from the University of Warwick (UW) sought to remedy this issue. So they created an ibuprofen-releasing patch capable of delivering a concentrated dose directly through the skin.


“Many commercial patches surprisingly don’t contain any pain relief agents at all, they simply soothe the body by a warming effect,” UW research chemist Professor David Haddleton said in a press release. “Our technology now means that we can for the first time produce patches that contain effective doses of active ingredients, such as ibuprofen, for which no patches currently exist. Also, we can improve the drug loading and stickiness of patches containing other active ingredients to improve patient comfort and outcome.”

Unlike traditional oral ibuprofen pills that dissolve in the stomach and immediately get to work, the patch releases a steady stream of pain relief over the course of 12 hours. The researchers believe this will open up a whole realm of possibilities for over-the-counter analgesic products that will help soothe back pain, nerve pain, and arthritis.

The patch uses a polymer technology to stick to the skin for the total time it takes to deploy its drug load — the ratio of the active drug to total content of the patch. The researchers say the drug load can be five to 10 times higher than that of traditional patches and gels, meaning it outperforms competition when it comes to drug delivery. What’s more, they say the patch can be easily removed without leaving residue, and that it’s “aesthetically pleasing,” too.

The researchers believe the technology behind the patch has a variety of uses as well. “Our transdermal patch technology expands the range of drugs that can be delivered via skin patches, and can significantly increase drug loading capabilities, while retaining adhesion and being thin and flexible,” Medherant CEO Nigel Davis said in the release. “Thus our patches provide a better experience for patients, enhance safety, and deliver increased efficacy, which will lead to economic benefits to the health care system.”

The patch could benefit the more than 30 million Americans who use NSAIDs — which include ibuprofen, aspirin, and acetaminophen — to quell everything from headaches to arthritis. First, however, it most likely have to be tested for effectiveness and safety. If it's proven to work, Haddleton and his team believe it will be available for over-the-counter use within the next two years.

Sunday, 6 December 2015

The best moments in Doctor 's life

Best Moments In a Doctor's Life.

1. The sound of restarting heartbeats when resuscitating a patient.
2. Closure after a difficult surgery where only the surgeon knows how he / she has saved a life.
3. A perfect surgery / procedure / stenting without complication.
4. Seeing the beautiful cute face of a healthy newborn.
5. Managing a major bleeder successfully.
6. Reversal of paralysis after thrombolysis (clot-buster injection).
7. Termination of Status Epilepticus (non-stop seizures/ convulsions).
8. Control over infection. Every infection is life threatening potentially.
9. Waking up of a comatose patient.
10. The genuine “Thank You” of a patient relieved of pain / stress / illness.
11. When someone random recognizes you in public and thanks you in front of your kids / family.
12. When the poorest of the poor collect enough money and gift you sweets for treating them free.
13. When a patient too educated to believe your truth goes to your professional competitors and many others, and is told the same, so returns to you with a greater faith.


14. When you can answer all questions asked by students after a lecture / clinic (without Herapheri / bluffing).
15. When a student performs well and patient gives a good feedback about them.
16. When you silently prove your clinical argument with good results.
17. When anyone at work says “Take some rest now.. You have been working too much”.


18. Qualifying for a medal/degree/publication of significant repute.
19. When you know that it’s not only the medical skills, but also your passionate involvement, speed and coordination that saved the patient.
20. When traffic police “Let you go” for minor offences just because you are a doctor, especially on the way to an emergency.
21. When someone says “I want to become a Doctor like you”.

There are many more. Every day is filled with both tears and smiles, and the doctor has to balance these by using his/her soul as the fulcrum. At the end of the day, death humbles everyone, but it is the doctor who stands to defend everyone else’s life without thinking if they are good or bad, friend or enemy.

Who will believe that money, home, family, cars, looks, luxury, and even love, romance are secondary joys for most doctors, after they have attended all their patient’s issues?

This pride is precious. The suffering a choice.The rewards immaterial.

A good doctor is the best a human being can be.

Saturday, 14 November 2015

socioeconomic position

Definitions

The National Center for HIV/AIDS, Viral Hepatitis, STD, and TB Prevention uses the words below to describe health equity and social determinants of health. These words are also used by the World Health Organization and the Department of Health and Human Service's Healthy People 2020.

Absolute Difference of Measure

A mathematical formula that measures "disparity between a group rate and a specified reference point." "The size and direction of the disparity depend on the selected reference point".
Formula: Simple difference = rate of interest – rate of reference point = Ri – Rr

Cultural Competence

Culture is the blended patterns of human behavior that include "language, thoughts, communications, actions, customs, beliefs, values, and institutions of racial, ethnic, religious, or social groups." Cultural competence is "a set of congruent behaviors, attitudes, and policies that come together in a system, agency, or among professionals that enables effective work in cross-cultural situations." "Competence" in the term cultural competence implies that an individual or organization has the capacity to function effectively "within the context of the cultural beliefs, behaviors, and needs presented by consumers and their communities." 

Determinants of Health

Factors that contribute to a person's current state of health. These factors may be biological, socioeconomic, psychosocial, behavioral, or social in nature. Scientists generally recognize five determinants of health of a population:
  • Biology and genetics. Examples: sex and age
  • Individual behavior. Examples: alcohol use, injection drug use (needles), unprotected sex, and smoking
  • Social environment. Examples: discrimination, income, and gender
  • Physical environment. Examples: where a person lives and crowding conditions
  • Health services. Examples: Access to quality health care and having or not having health insurance

Health

A state of complete physical, mental, and social well-being and not just the absence of sickness or frailty 

Health Disparity

A type of difference in health that is closely linked with social or economic disadvantage. Health disparities negatively affect groups of people who have systematically experienced greater social or economic obstacles to health. These obstacles stem from characteristics historically linked to discrimination or exclusion such as race or ethnicity, religion, socioeconomic status, gender, mental health, sexual orientation, or geographic location. Other characteristics include cognitive, sensory, or physical disability.

Health Equity

When all people have "the opportunity to 'attain their full health potential' and no one is 'disadvantaged from achieving this potential because of their social position or other socially determined circumstance'

Health Inequality

Differences, variations, and disparities in the health achievements of individuals and groups of people.

Health Inequity

A difference or disparity in health outcomes that is systematic, avoidable, and unjust .

Health Literacy

Whether a person can obtain, process, and understand basic health information and services that are needed to make suitable health decisions. Health literacy includes the ability to understand instructions on prescription drug bottles, appointment cards, medical education brochures, doctor's directions, and consent forms. It also includes the ability to navigate complex health care systems. Health literacy is not simply the ability to read. It requires a complex group of reading, listening, analytical, and decision-making skills and the ability to apply these skills to health situations.

Index of Disparity

A regression-based measure that is used by scientists and retains the inherent order of categories like education or income but incorporates the population weights of the categories. The size of each category is taken into account by placing the groups on an axis that reflects the cumulative proportion of the population represented by the ordered groups. The index of disparity can be absolute (slope referred to as Slope Index of Inequality) or relative (slope referred to as Relative Index of Inequality)

Individual Risk Factors

Characteristics of a person that may explain health or behavior. Some examples include a person's age or whether a person smokes.
Poverty
When a person or group of people lack human needs because they cannot afford them. Human needs include clean water, nutrition, health care, education, clothing, and shelter. The U.S. Social Security Administration originally developed the definitions that are used to help calculate and determine poverty. Families or people with income below a certain limit are considered to be below the poverty level.

Social Determinants of Health

The complex, integrated, and overlapping social structures and economic systems that are responsible for most health inequities. These social structures and economic systems include the social environment, physical environment, health services, and structural and societal factors. Social determinants of health are shaped by the distribution of money, power, and resources throughout local communities, nations, and the world.

Socioeconomic Gradient in Health

This term refers to the stepwise fashion health outcomes improve as socioeconomic position improves. This gradient can be measured by a person's income, occupation, or the highest level of education he or she has.

Socioeconomic Position

An aggregate concept that includes both resource-based and prestige-based measures, which are linked to both childhood and adult social class position. Resource-based measures refer to material and social resources and assets, including income, wealth, and educational credentials. Terms used to describe inadequate resources include "poverty" and "deprivation." Prestige-based measures refer to a person's rank or status in a social hierarchy. Prestige-based measures are typically evaluated with reference to people's access to and consumption of goods, services, and knowledge, that are linked to their occupational prestige, income, and education level 

Socioeconomic Status

A composite measure that typically incorporates economic, social, and work status. Economic status is measured by income. Social status is measured by education, and work status is measured by occupation. Each status is considered an indicator. These three indicators are related but do not overlap.

Births in the United States, 2016

Key findings

Data from the National Vital Statistics System
  • The U.S. general fertility rate declined to 62.0 births per 1,000 women aged 15–44 in 2016, down 1% from 2015.
  • Birth rates declined among women under age 30 in 2016, and rose for women aged 30–44.
  • The cesarean delivery rate continued to decline in 2016, down to 31.9% of all births.
  • The preterm birth rate rose for the second straight year to 9.85% in 2016.
  • The 2016 rate of triplet and higher-order multiple births was 48% lower than the 1998 peak.
This report presents several key demographic and maternal and infant health indicators using 2016 final birth data. Trends in the general fertility rate (the number of births per 1,000 women aged 15–44), age-specific birth rates, cesarean delivery, preterm, and triplet and higher-order multiple birth rates are presented by age of mother. For each indicator, data for 2016 are compared with 2015, and also with a year representing a recent high or low rate.

Birth rates for women under age 30 declined in 2016, whereas rates for women 30 and over rose.

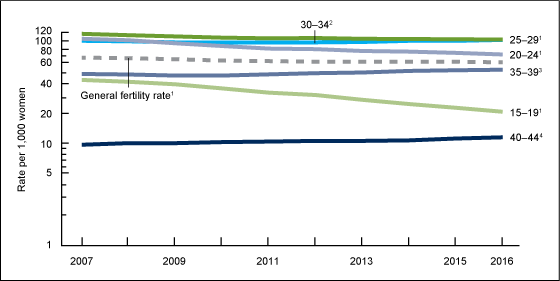
  • The general fertility rate declined 1% in 2016, to 62.0 births per 1,000 women aged 15–44. The rate is down 11% since 2007, the most recent high (Figure 1).
  • The birth rate for teens aged 15–19 declined 9% from 2015 to 2016, to 20.3 births per 1,000 women. The rate has declined 51% since 2007.
  • Birth rates for women in their twenties declined from 2015 to 2016, down 4% for women aged 20–24 (to 73.8 per 1,000 births) and 2% for women aged 25–29 (to 102.1).
  • Birth rates for women in their thirties and early forties rose from 2015 to 2016, up 1% for women aged 30–34 (to 102.7), 2% for women aged 35–39 (to 52.7), and 4% for women aged 40–44 (to 11.4). Since 2007, the rate has risen 19% for women in their early forties, 2% for women in their early thirties, and 11% for women in their late thirties.
    • Figure 1. General fertility and age-specific birth rates, by age of mother: United States, 2007–2016
 Figure 1 is a line chart showing the general fertility rate and age-specific birth rates in the United States from 2007 through 2016.
  Significant decreasing trend for 2007–2016 (p < 0.05).
 Significant decreasing trend for 2007–2011; significant increasing trend for 2011–2016 (p < 0.05).
 Significant decreasing trend for 2007–2010; significant increasing trend for 2010–2016 (p < 0.05).
Significant increasing trend for 2007–2016 (p < 0.05).

NOTES: Rates are plotted on a logarithmic scale. The general fertility rate is the number of births per 1,000 women aged 15–44; the age-specific birth rate is the number of births per 1,000 women in the specified age group.

The cesarean delivery rate dropped below 32% in 2016.

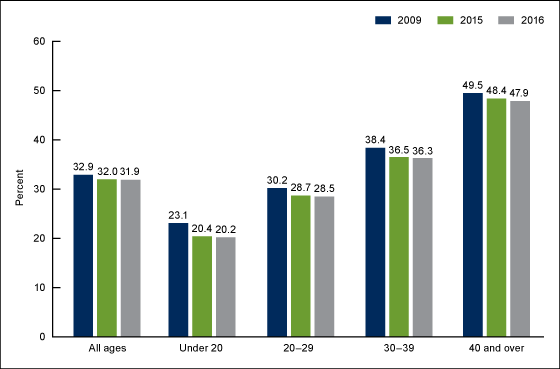
  • The cesarean delivery rate declined to 31.9% in 2016, from 32.0% in 2015. The rate is down 3% from the peak of 32.9% in 2009 (Figure 2).
  • Cesarean delivery rates decreased slightly (about 1%) from 2015 to 2016 for all maternal age groups.
  • In 2016, rates were down 13.0% for mothers aged 20 and under (to 20.2), 6% for those aged 20–29 (28.5%), 5% for those aged 30–39 (36.3%), and 3% for women aged 40 and over (47.9%) from the 2009 peaks.
    • Figure 2. Cesarean delivery rates, by age of mother: United States, 2009, 2015, and 2016
Figure 2 is a bar chart showing cesarean delivery rates by age of mother for the United States for 2009, 2015, and 2016.

NOTES: Significant differences in rates for all years for all age groups (p < 0.05

The preterm birth rate rose for the second straight year in 2016.

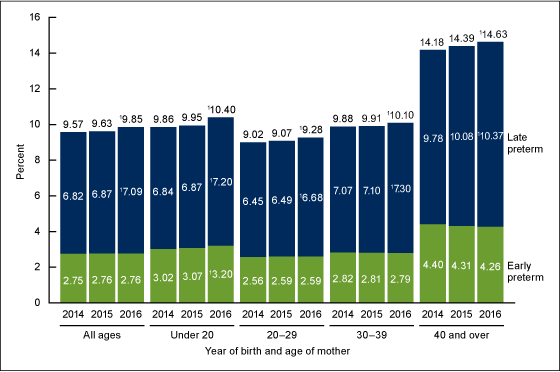
  • The preterm birth rate rose 2% in 2016 to 9.85%, from 9.63% in 2015, continuing the increase observed from 2014 (9.57% and a recent low) to 2015 (Figure 3).
  • Most of the increase from 2014 to 2016 was among infants born late preterm, up 4% from 2014 to 2016 (6.82% to 7.09%). The early preterm birth rate was essentially unchanged (2.76% in 2016).
  • Increases in late preterm birth rates occurred among all age groups from 2015 to 2016 and from 2014 to 2016. For 2014–2016, late preterm rates rose 5% for births to women under age 20, 4% for births to women in their twenties, 3% for births to women in their thirties, and 6% for births to women aged 40 and over.
    • Figure 3. Preterm birth rates, by age of mother: United States, 2014–2016
  • Figure 3 is a bar chart showing preterm birth rates by age of mother in the United States for 2014, 2015, through 2016.
Significant increasing trend (p < 0.05).

NOTES: Figures may not equal totals due to rounding

Triplet and higher-order multiple births continued to decline in 2016.

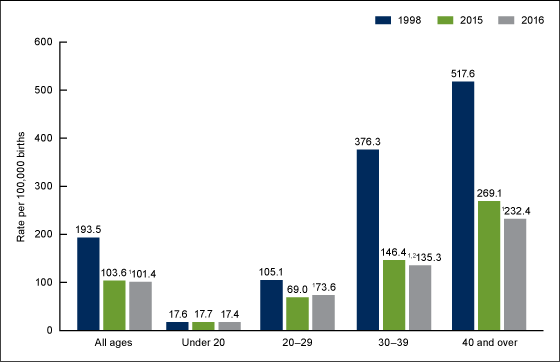
  • The 2016 rate of triplet and higher-order multiple births was 101.4 per 100,000 total births, a non-statistically significant decline from 2015 (103.6). The 2016 rate declined 48%, to nearly one-half of the 1998 peak, 193.5 per 100,000 (Figure 4).
  • Declines in triplet and higher-order multiple birth rates were seen for each group aged 20 and over from 1998–2016, with the largest declines among women aged 30–39 (down 64%) and women aged 40 and over (down 55%).
  • For 2015–2016, the rate declined significantly for women aged 30–39 (from 146.4 to 135.3 per 100,000); changes for other age groups were not statistically significant.

Figure 4. Triplet and higher-order multiple birth rates, by age of mother: United States, 1998, 2015, and 2016
Figure 4 is a bar chart showing triplet and higher-order multiple birth rates by age of mother in the United States for 1998, 2015, and 2016.
1Significant difference in rate from 1998 (p < 0.05).
2Significant difference in rate from 2015 (p < 0.05).
NOTE: Access data table for Figure 4.

Summary

Birth certificate data for the United States in 2016 show a continuation of recent trends for several key natality measures. The general fertility rate continued to fall, with record lows in teen childbearing and for women in their twenties . In contrast, rates for older women continued to rise, resulting in a higher birth rate for women aged 30–34 than for women aged 25–29 for the first time since 1940 when these data became available . The cesarean delivery rate declined 3% from the record high in 2009 and was under 32% in 2016 for the first year in a decade (31.8% in 2007) . The rate for triplet and higher-order multiple births has been on the decline since 1998, the record highest year for this rate, and was the lowest in more than two decades (since 1992) . For both measures, declines were observed for most or all age groups. The rate of preterm birth had been on the decline in the United States (from 10.44% in 2007 to 9.57% in 2014) . Although the recent upturn in the preterm birth rate is of shorter duration (2014–2016) than the other measures presented in this report, it is of concern—infants born prior to full term (39–40 completed weeks of gestation) are at higher risk of morbidity and mortality than those born at a later gestational age . Provisional data indicate an extension of the upward trend in this rate through the first quarter of 2017.

Definitions

General fertility rate: Number of births per 1,000 women aged 15–44.
Age-specific birth rate: Number of births per 1,000 women in the specified age group.
Cesarean delivery rate: Number of births delivered by cesarean per 100 births.
Preterm birth rate: Number of births delivered before 37 completed weeks of gestation per 100 births. Gestational age is based on the obstetric estimate of gestation.
Early preterm birth rate: Number of births delivered before 34 completed weeks of gestation per 100 births.
Late preterm birth rate: Number of births delivered at 34–36 completed weeks of gestation per 100 births.
Triplet/+ birth rate: Number of triplet and higher-order multiple births per 100,000 total births.

Data source and methods

This report is based on data from the Natality Data File from the National Vital Statistics System (NVSS). The vital statistics natality file is based on information derived from birth certificates and includes information for all births occurring in the United States. This data brief accompanies the release of the 2016 natality public-use file . A more detailed analysis of the topics presented in this report and many others, including births to unmarried women, prenatal care, tobacco use during pregnancy, source of payment for delivery, pregnancy risk factors, receipt of Women, Infants, and Children (WIC) food, maternal morbidity, and breastfeeding, is possible by using the annual natality files . Data are not presented separately in this report for women aged 15 and under or age 45 and over. For 2016 information on these age groups, see “Births: Provisional Data for 2016”.
References to increases or decreases in rates or percentages indicate that differences are statistically significant at the 0.05 level. Trends in rates for (Figure 1) were evaluated using the Joinpoint Regression Program. Trends in rates for (Figures 2–4) were assessed using the Cochran-Armitage test for trends, a modified Chi-squared test. Computations exclude records for which information is unknown.

Mortality in the United States, 2015

Mortality in the United States, 2015


Key findings

Data from the National Vital Statistics System, Mortality
  • Life expectancy for the U.S. population in 2015 was 78.8 years, a decrease of 0.1 year from 2014.
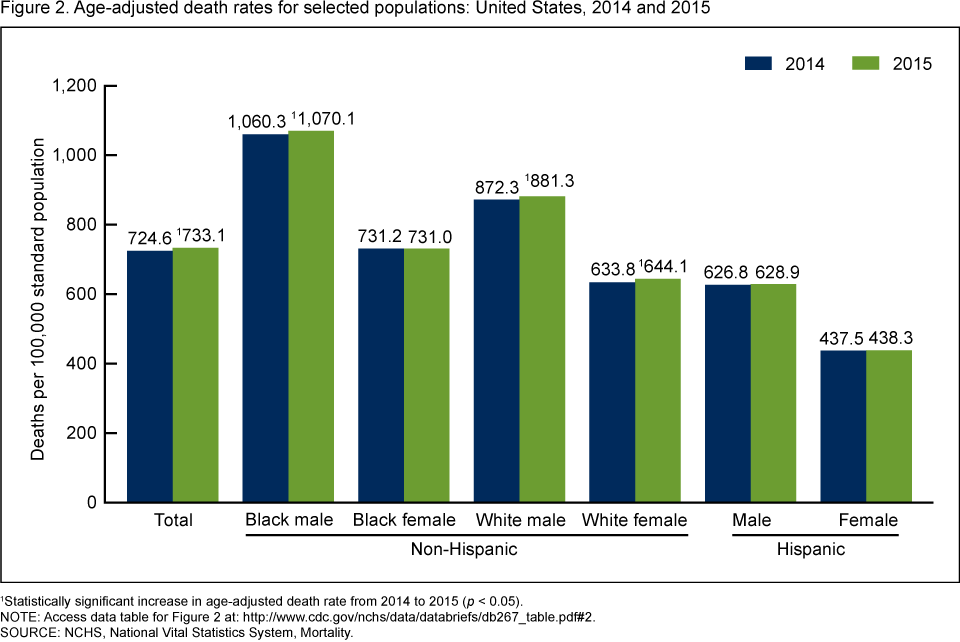
  • The age-adjusted death rate increased 1.2% from 724.6 deaths per 100,000 standard population in 2014 to 733.1 in 2015.
  • The 10 leading causes of death in 2015 remained the same as in 2014. Age-adjusted death rates increased for eight leading causes and decreased for one.
  • The infant mortality rate of 589.5 infant deaths per 100,000 live births in 2015 was not significantly different from the 2014 rate.
  • The 10 leading causes of infant death in 2015 remained the same as in 2014, although two causes exchanged ranks.
This report presents 2015 U.S. final mortality data on deaths and death rates by demographic and medical characteristics. These data provide information on mortality patterns among U.S. residents by variables such as sex, race and ethnicity, and cause of death. Life expectancy estimates, age-adjusted death rates by race and ethnicity and sex, 10 leading causes of death, and 10 leading causes of infant death were analyzed by comparing 2015 and 2014 final data 

How long can we expect to live?

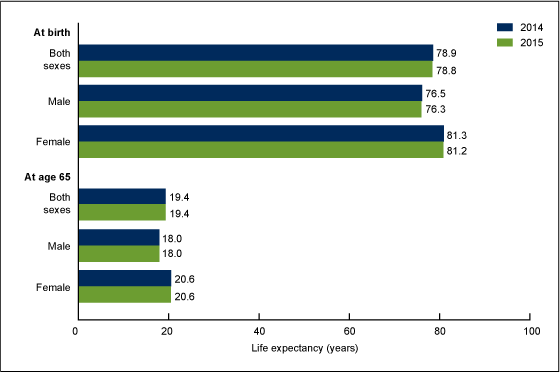
In 2015, life expectancy at birth was 78.8 years for the total U.S. population—a decrease of 0.1 year from 78.9 years in 2014 (Figure 1). For males, life expectancy changed from 76.5 years in 2014 to 76.3 years in 2015—a decrease of 0.2 years, and for females, life expectancy decreased 0.1 year from 81.3 years in 2014 to 81.2 years in 2015.
Life expectancy for females was consistently higher than it was for males. In 2015, the difference in life expectancy between females and males increased 0.1 year from 4.8 years in 2014 to 4.9 years in 2015.
In 2015, life expectancy at age 65 for the total population was 19.4 years, the same as in 2014. Life expectancy at age 65 was 20.6 years for females and 18.0 years for males, both unchanged from 2014. The difference in life expectancy at age 65 between females and males remained at 2.6 years in 2015.
Figure 1. Life expectancy at selected ages, by sex: United States, 2014 and 2015
           

What are the age-adjusted death rates for race-ethnicity-sex groups?

The age-adjusted death rate for the total population increased 1.2% from 724.6 per 100,000 standard population in 2014 to 733.1 in 2015 (Figure 2). Age-adjusted death rates increased in 2015 from 2014 for non-Hispanic black males (0.9%), non-Hispanic white males (1.0%), and non-Hispanic white females (1.6%). Rates did not change significantly for non-Hispanic black females, Hispanic males, and Hispanic females from 2014 to 2015.


What are the leading causes of death?

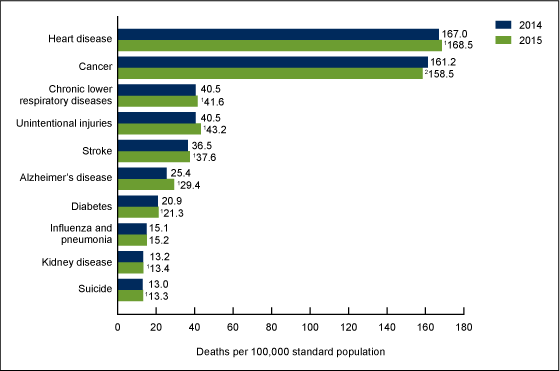
In 2015, the 10 leading causes of death (heart disease, cancer, chronic lower respiratory diseases, unintentional injuries, stroke, Alzheimer’s disease, diabetes, influenza and pneumonia, kidney disease, and suicide) remained the same as in 2014 (Figure 3). The 10 leading causes accounted for 74.2% of all deaths in the United States in 2015.
From 2014 to 2015, age-adjusted death rates increased for 8 of 10 leading causes of death and decreased for 1. The rate increased 0.9% for heart disease, 2.7% for chronic lower respiratory diseases, 6.7% for unintentional injuries, 3.0% for stroke, 15.7% for Alzheimer’s disease, 1.9% for diabetes, 1.5% for kidney disease, and 2.3% for suicide. The rate decreased by 1.7% for cancer. The rate for influenza and pneumonia did not change significantly.
Figure 3. Age-adjusted death rates for the 10 leading causes of death in 2015: United States, 2014 and 2015
1Statistically significant increase in age-adjusted death rate from 2014 to 2015 (p < 0.05).
2Statistically significant decrease in age-adjusted death rate from 2014 to 2015 (p < 0.05).
NOTES: A total of 2,712,630 resident deaths were registered in the United States in 2015. The 10 leading causes accounted for 74.2% of all deaths in the United States in 2015. Causes of death are ranked according to number of deaths

What are the leading causes of infant death?

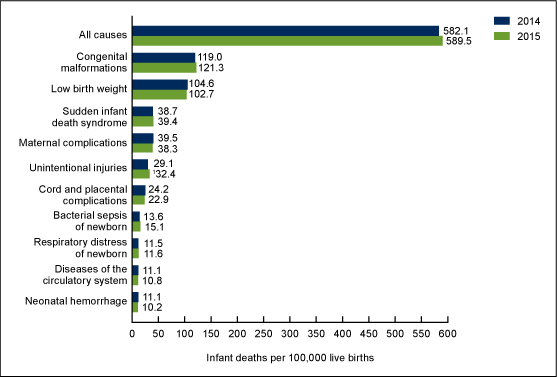
The infant mortality rate (IMR)—the ratio of infant deaths to live births in a given year—is generally regarded as a good indicator of the overall health of a population. The IMR changed from 582.1 infant deaths per 100,000 live births in 2014 to 589.5 in 2015, but this change was not statistically significant.
The 10 leading causes of infant death in 2015 accounted for 68.6% of all infant deaths in the United States. The leading causes remained the same as in 2014, although two causes exchanged ranks (Figure 4). The IMR for unintentional injuries increased 11.3% from 29.1 infant deaths per 100,000 live births in 2014 to 32.4 in 2015. Mortality rates for other leading causes of infant death did not change significantly.

Figure 4. Infant mortality rates for all causes and the 10 leading causes of infant death in 2015: United States, 2014 and 2015
1Statistically significant increase in mortality rate from 2014 to 2015 (< 0.05).
NOTES: A total of 23,455 deaths occurred in children under age 1 year in the United States in 2015, with an infant mortality rate of 589.5 infant deaths per 100,000 live births. The 10 leading causes of infant death in 2015 accounted for 68.6% of all infant deaths in the United States. Causes of death are ranked according to number of deaths

Summary

In 2015, a total of 2,712,630 resident deaths were registered in the United States—86,212 more deaths than in 2014. From 2014 to 2015, the age-adjusted death rate for the total population increased 1.2%, and life expectancy at birth decreased 0.1 year. The age-adjusted death rate increased for non-Hispanic white males, non-Hispanic white females, and non-Hispanic black males. The rate for the total population rose significantly for the first time since 1999 .
The 10 leading causes of death in 2015 remained the same as in 2014. Age-adjusted death rates increased for eight leading causes. The only decrease in age-adjusted death rates among the 10 leading causes of death was for cancer. Life expectancy at birth decreased 0.1 year from 78.9 years in 2014 to 78.8 in 2015, largely because of increases in mortality from heart disease, chronic lower respiratory diseases, unintentional injuries, stroke, Alzheimer’s disease, diabetes, kidney disease, and suicide.
In 2015, a total of 23,455 deaths occurred in children under 1 year, which was 240 more infant deaths than in 2014. The leading causes of infant death were the same in 2015 as in 2014, although maternal complications, the third leading cause of infant death in 2014, became the fourth leading cause in 2015, while Sudden infant death syndrome, the fourth leading cause of infant death in 2014, became the third leading cause in 2015. The only significant change among the 10 leading causes of infant death was an 11.3% increase in the IMR for unintentional injuries.

Definitions

Cause-of-death: Based on medical information—including injury diagnoses and external causes of injury—that is entered on death certificates filed in the United States. This information is classified and coded in accordance with the International Statistical Classification of Diseases and Related Health Problems, Tenth Revision  (ICD-10).
Death rates: For 2015, based on population estimates for July 1, 2015, that are consistent with the April 1, 2010, census. These population estimates (as well as population figures for the 2010 census) are available on the National Center for Health Statistics’ (NCHS) website Age-adjusted death rates are useful when comparing different populations because they remove the potential bias that can occur when the populations being compared have different age structures. NCHS uses the direct method of standardization; see Technical Notes of “Deaths: Final Data for 2014” for more discussion.
Life expectancy: The expected average number of years of life remaining at a given age. It is denoted by e, which means the average number of subsequent years of life for someone now aged x. Life expectancy estimates for 2015 are based on a methodology first implemented with 2008 final mortality data (4). Life expectancies for 2014 were revised using updated Medicare data; therefore, figures may differ from those previously published.
Leading causes of death: Ranked according to the number of deaths assigned to rankable causes
Infant mortality rate (IMR): Computed by dividing the number of infant deaths in a calendar year by the number of live births registered for that same time period. IMR is the most widely used index for measuring the risk of dying during the first year of life.

Data source and methods

The data shown in this report reflect information collected by NCHS for 2014 and 2015 from death certificates filed in all 50 states and the District of Columbia and compiled into national data known as the National Vital Statistics System. Death rates shown in this report are calculated based on postcensal population estimates as of July 1, 2014, and July 1, 2015, which are consistent with the April 1, 2010, census. Differences between death rates were evaluated using a two-tailed z  test.

Wednesday, 21 October 2015

Designer antibodies may rid body of AIDS virus

Anti-HIV drugs have extended life for millions of people, but they have never eliminated the virus from anyone. That’s because HIV integrates its genetic material into the chromosomes of some white blood cells, helping it escape notice of the immune system. Two new studies show that artificial antibodies could “redirect” the immune response to these latently infected cells and help drain those HIV reservoirs in the body. But this creative strategy also carries risks.


“The rationale is sound, and the data are exciting, but we will need to move carefully,” says Steven Deeks, an HIV/AIDS clinician at the University of California, San Francisco (UCSF), who tests cure strategies. “There really is zero room for error.”

Several previous studies have explored whether drugs can shock cells that are infected with latent HIV to make new viruses, setting them up for the kill by the natural immune response. But this new work ups the ante by designing so-called bispecific antibodies that both promise to reverse latency and then do the mop-up work. “The dual activity makes this an attractive new approach,” says Sharon Lewin, a HIV cure researcher who directs the Peter Doherty Institute for Infection and Immunity in Melbourne, Australia. “It’s exciting.”

The two new papers, which only appear online so far, mainly involve test tube experiments. One, described in Nature Communications today, was conducted by a team from the Vaccine Research Center at the U.S. National Institute of Allergy and Infectious Diseases (NIAID) in Bethesda, Maryland. The second study appeared last month in The Journal of Clinical Investigation (JCI) and involved a collaboration between three universities and a biotech company.

Both groups designed artificial versions of antibodies, the Y-shaped molecules made by the immune system to target pathogens. With natural antibodies, both “arms” of the Y clasp the same target. But the arms of bispecific antibodies each grab a unique protein. In this case, both teams designed their antibodies to clasp an HIV protein and CD3, a receptor found on the surface of white blood cells.

The bispecific antibodies focus on the CD3 receptor for two reasons. One is that HIV hides its DNA inside white blood cells, or T lymphocytes, that have CD3 receptors. The other is that a second type of CD3-studded lymphocyte known as a killer T cell destroys HIV-infected cells.

The bispecific antibody first binds to CD3 on cells that harbor latent HIV. This prompts the cells to divide, an “activation” process that wakes up the sleeping virus. New HIV proteins are subsequently produced that migrate to the surface of the cell.

Now, the bispecific antibody grabs a killer T cell that has a CD3 receptor and, with its second arm, finds a recently activated cell that has HIV proteins on its surface. Bringing the killer T cell in close proximity to the infected cell effectively stuffs the prey into the lion’s mouth. “The molecule works just as you’d hope it would in several assays,” says John Mascola, director of NIAID’s Vaccine Research Center and head of the group reporting the Nature Communications study.

But neither team has yet shown that their bispecific antibodies can actually reduce reservoirs of HIV in monkeys, which are commonly used to study the AIDS virus. Those studies are underway, and it will take at least a year before either team tests the concepts in HIV-infected people. David Margolis, a virologist at the University of North Carolina, Chapel Hill, and co-author of the JCI study, says draining a reservoir ultimately may require combining bispecific antibodies with other latency reversing approaches and immune system stimulators like anti-HIV vaccines.

UCSF’s Deeks cautions that anti-CD3 antibodies can cause too much activation of T cells, leading to a massive inflammatory reaction that damages organs and can even cause death. Indeed, in one 1999 study of anti-CD3 antibodies used to purge reservoirs in three HIV-infected people.

Friday, 2 October 2015

Fat Rich Food during Pregnancy

Fat Rich Food during Pregnancy can Lead to Obesity in Children


A recent research report has concluded that intake of a fat rich food during pregnancy and lactation can potentially put a child at a higher risk of obesity in later life. Published in the Journal of Physiology, the report highlights that the reflex mechanism which otherwise keeps a check on the amount of food we eat, malfunctions in children due to fat-rich diet consumed during pregnancy. This reflex mechanism becomes less sensitive, ultimately resulting in obesity in later life.
As a part of the research, the researchers fed one group of rats high-fat diet during pregnancy and lactation. Their offspring were fed the same diet after they weaned off. As the rats reached adolescence, their neural activity involved in energy balance and appetite regulation was measured by the researchers. “We looked at the circuits that relay information from the stomach and the small intestine to the brain and back to the stomach telling it how to work,” said Kirsteen Browning, lead investigator and Associate Professor of neural and behavioural sciences at the Penn State College of Medicine. “We found that parts of these reflexes were actually compromised even before we saw obesity,” Browning added.
She mentioned that it is not a norm that all mothers who consumed fat-rich diet had obese children. Also, obese people may not necessarily have mothers who had a fat-rich diet while they were pregnant. “It is just one more risk factor. An understanding of the biological mechanisms underpinning obesity could help stem the tide of obesity,” she added.
She however stated that, “It is time that we start to take seriously the idea that obesity is, in part, a brain disease.”

Sunday, 9 August 2015

How to choose M.Pharm project


  How to choose M.Pharm project

Step 1: Select broad themes you are interested.


(1) The first thing you need to do is jot down the general themes what makes you interest in your subject area. If you are doing masters then think about what topics make you interested in your masters degree.


(2) Then think about ''HOT'' topics in your field. For this one you need to look for either in the research papers or in the popular journals like ''Science Direct'' or ''Pubmed''


(3) Look for popular discussions about your interested topic in discussion forums relevant to pharmacy profession.


 (4) Consider to think about your interests from your childhood and young age. So far you got some idea so what you need to do is take a pen and paper and write down your thoughts.


Step 2: What are particular things making you interest in those themes?

            This is the step you need to put little bit more effort, in fact it is for example: In the general theme if you got up with one or more questions need to be answer then consider them as separably and make the list of your interesting themes under those generalized them.  By doing this you come to know about the topics of your interest in the priority wish list.


Step 3: Ask questions about those topics of interest?

            So it is a time to think about asking questions yourself about the topics of interest. These questions you need investigate further in your project, think about these questions in details and try to think it's relevance to other topics of interest.

Step 4: Now it is a time to think about your research question viability.

            Once you have the questions of interest, try to think about it's sensibility and appropriateness about answering the question. Here 'Viability' is whether the project is manageable to do at your institute or not and the timeline required to do such a project. 


Step 5: Final choice be careful.

            After going through stage 4 several times, you will think about possible viable projects options. The last question but very important question ask yourself : Does the topic really exciting you or not?. For this question your answer need to be 'YES'. You need to be live up with this topic for few months or possibly for one year in case of postgraduate people and it requires 3 years for doctoral students. 


            We will discuss further analysis in terms of specific subject related projects  in the next post...If you have any doubts feel free to comment below the post.


Monday, 27 July 2015

Types of Doctors In English


Types of Doctors in English


DOCTOR/M.D. : a person who has a degree of Doctor of Medicine, works to help sick people, and is licensed to prescribe medicine

  When you are sick, you should see a doctor.


GENERAL PRACTIONER/G.P. : an M.D. who treats most common diseases and ailments

  Our G.P. takes care of the whole family in one visit.


PEDIATRICIAN : a specialist in children’s health

  As soon as the baby was born he was examined by a pediatrician.


DENTIST :a doctor who takes care of the teeth

  It’s a good idea to see a dentist at least once a year.


ORTHODONTIST: a dentist who specializes in straightening teeth

The orthodontist fixed her crooked teeth, and now she has a beautiful smile.


PERIODONTIST : a dentist who specializes in gums

The periodontist was able to help prevent gum recession in most patients.


DERMATOLOGIST : a skin specialist

A dermatologist can help you with your allergies.


E.N.T. / ear, nose, and throat doctor : a specialist for the ear, the nose, and the throat

She sees an E.N.T. for her sinusitis.


EYE DOCTOR/OPTHALMOLOGIST : a specialist for eyes

The ophthalmologist prescribed glasses for our son.


GASTROENTEROLOGIST: a stomach specialist

He is seeing a gastroenterologist to help cure his digestive problem.


GYNECOLOGIST : a specialist in women’s health

Many women are checked by a gynecologist once a year.


OBSTETRICIAN : a specialist in the delivery of babies

As soon as she suspected she was pregnant, she went to see an obstetrician.


ORTHOPEDIST : a specialist in bones

When he broke his leg, the orthopedist put it in a cast.


PODIATRIST: a specialist in feet

The podiatrist told her not to wear high-heeled shoes.


SURGEON : a specialist who performs major operations

The surgeon was in the operating room for four hours.

Saturday, 25 July 2015

Caution on three life saving drugs

IPC recommends caution on 3 life saving drugs in market to CDSCO based on ADRs

Indian Pharmacopeia Commission’s (IPCs) signal review panel recently submitted strategic recommendation to the Central Drugs Standard Control Organisation (CDSCO) on the 3 important life saving drugs running in the market. These reports were submitted based on the detailed observation made by the expert panel following the adverse drug reaction (ADR) report generated from different ADR centres across the country.

Based on the evaluation report received from different AMCs under the Pharmacovigilance Programme of India (PvPI), it was found that use of carbamazepine is associated to cause Stevens Johnson Syndrome (SJS) in some patients. Dr V Kalaiselvan, principal scientific officer from the Indian Pharmacopoeia Commission informed that considering the safety of the patients, the review panel recommended the CDSCO to direct all the manufacturers to insert a clear warning on its label on the possible side effects of the drug, to caution the patients.

It is understood that carbamazepine which is available in different brands like Carbatrol, Epitol, Equetro, TEGretol, TEGretol XR etc. is a commonly prescribed anticonvulsant drug for epilepsy, which works by decreasing nerve impulses that cause seizures and pain. It is also used to treat seizures and nerve pain such as trigeminal neuralgia and diabetic neuropathy along with treating bipolar disorder.

Dr Kalaiselvan further stated that this report has been submitted after extensively analysing and studying ADR reports generated from more than 100 ADR centres across the country. SJS is a clinical syndrome presumed to be a hypersensitivity reaction manifested initially with prodromal symptoms of fever, malaise and a sore throat. The prodromal phase is then followed in some days by an acute polymorphous dermatologic syndrome manifested as erythematous maculo-papular like lesions, target lesions, bullae, vesicles, involvement of at least two mucous membranes, conjunctivitis and an associated systemic toxic state.

“Considering the seriousness of this matter, the panel has suggested the DCGI to take the above requisite steps for public safety. Apart from carbamazepine, IPC has also submitted recommendation to the Centre on two anti cancer drugs sunitinib and pazopanib as well. Based on the panels observation it has recommended the CDSCO to closely monitor these two drugs as there have been several incidents of ADRs reported from the use of these drugs,” he stressed.

Sunitinib is used to treat gastrointestinal stromal tumours (GIST) that grows in the stomach, intestine (bowel), or esophagus tube that connects the throat with the stomach in people with tumours that were not treated successfully with imatinib or people who cannot take imatinib. It is also used to treat advanced renal cell carcinoma (RCC), a type of cancer that begins in the cells of the kidneys and treat pancreatic neuroendocrine tumours (pNET), a type of tumour that begins in certain cells of the pancreas in people with tumours that have worsened and cannot be treated with surgery.

While pazopanib is used to treat advanced RCC in adults, it works by slowing or stopping the spread of cancer cells.

These observations were made based on report collected from over 60 ADR centres across the country. Signal detection in pharmacovigilance comprises of selection of drug adverse reaction, preliminary assessment of available evidence and a follow up on how the signal develops.