Saturday, 14 November 2015

Mortality in the United States, 2015

Mortality in the United States, 2015


Key findings

Data from the National Vital Statistics System, Mortality
  • Life expectancy for the U.S. population in 2015 was 78.8 years, a decrease of 0.1 year from 2014.
  • The age-adjusted death rate increased 1.2% from 724.6 deaths per 100,000 standard population in 2014 to 733.1 in 2015.
  • The 10 leading causes of death in 2015 remained the same as in 2014. Age-adjusted death rates increased for eight leading causes and decreased for one.
  • The infant mortality rate of 589.5 infant deaths per 100,000 live births in 2015 was not significantly different from the 2014 rate.
  • The 10 leading causes of infant death in 2015 remained the same as in 2014, although two causes exchanged ranks.
This report presents 2015 U.S. final mortality data on deaths and death rates by demographic and medical characteristics. These data provide information on mortality patterns among U.S. residents by variables such as sex, race and ethnicity, and cause of death. Life expectancy estimates, age-adjusted death rates by race and ethnicity and sex, 10 leading causes of death, and 10 leading causes of infant death were analyzed by comparing 2015 and 2014 final data 

How long can we expect to live?

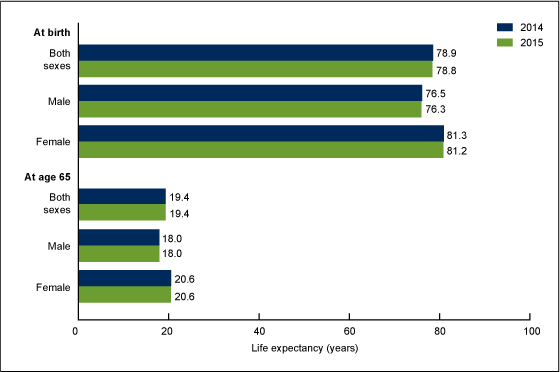
In 2015, life expectancy at birth was 78.8 years for the total U.S. population—a decrease of 0.1 year from 78.9 years in 2014 (Figure 1). For males, life expectancy changed from 76.5 years in 2014 to 76.3 years in 2015—a decrease of 0.2 years, and for females, life expectancy decreased 0.1 year from 81.3 years in 2014 to 81.2 years in 2015.
Life expectancy for females was consistently higher than it was for males. In 2015, the difference in life expectancy between females and males increased 0.1 year from 4.8 years in 2014 to 4.9 years in 2015.
In 2015, life expectancy at age 65 for the total population was 19.4 years, the same as in 2014. Life expectancy at age 65 was 20.6 years for females and 18.0 years for males, both unchanged from 2014. The difference in life expectancy at age 65 between females and males remained at 2.6 years in 2015.
Figure 1. Life expectancy at selected ages, by sex: United States, 2014 and 2015
           

What are the age-adjusted death rates for race-ethnicity-sex groups?

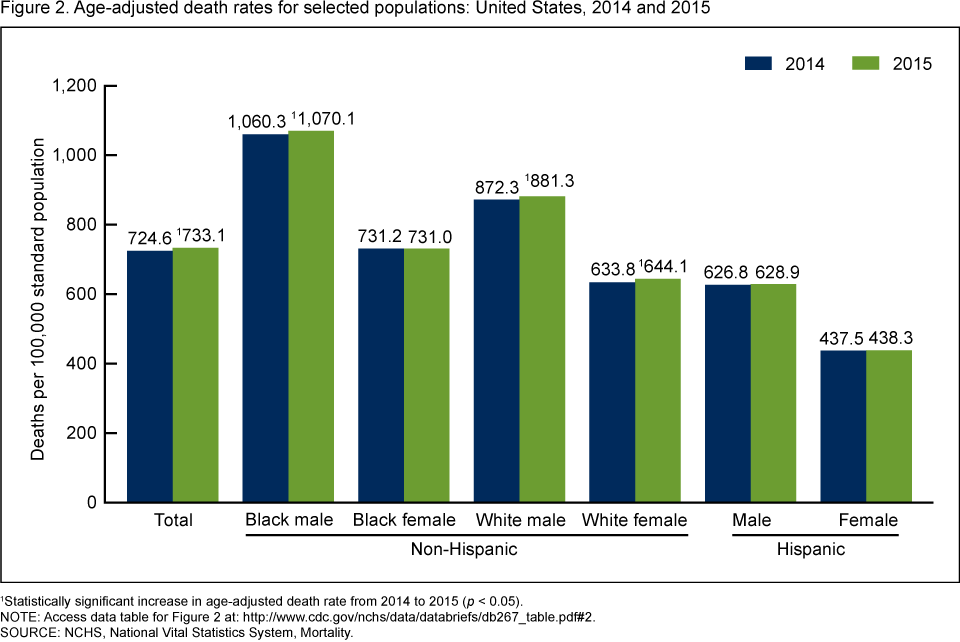
The age-adjusted death rate for the total population increased 1.2% from 724.6 per 100,000 standard population in 2014 to 733.1 in 2015 (Figure 2). Age-adjusted death rates increased in 2015 from 2014 for non-Hispanic black males (0.9%), non-Hispanic white males (1.0%), and non-Hispanic white females (1.6%). Rates did not change significantly for non-Hispanic black females, Hispanic males, and Hispanic females from 2014 to 2015.
          

What are the leading causes of death?

In 2015, the 10 leading causes of death (heart disease, cancer, chronic lower respiratory diseases, unintentional injuries, stroke, Alzheimer’s disease, diabetes, influenza and pneumonia, kidney disease, and suicide) remained the same as in 2014 (Figure 3). The 10 leading causes accounted for 74.2% of all deaths in the United States in 2015.
From 2014 to 2015, age-adjusted death rates increased for 8 of 10 leading causes of death and decreased for 1. The rate increased 0.9% for heart disease, 2.7% for chronic lower respiratory diseases, 6.7% for unintentional injuries, 3.0% for stroke, 15.7% for Alzheimer’s disease, 1.9% for diabetes, 1.5% for kidney disease, and 2.3% for suicide. The rate decreased by 1.7% for cancer. The rate for influenza and pneumonia did not change significantly.
Figure 3. Age-adjusted death rates for the 10 leading causes of death in 2015: United States, 2014 and 2015
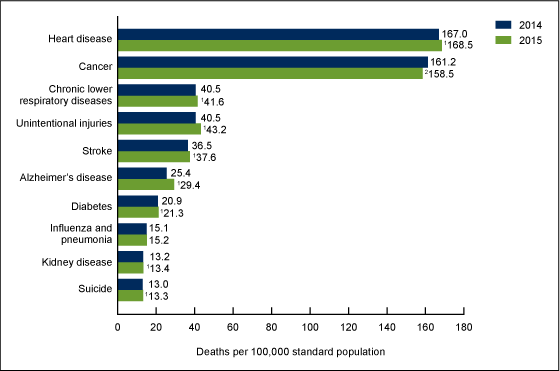
1Statistically significant increase in age-adjusted death rate from 2014 to 2015 (p < 0.05).
2Statistically significant decrease in age-adjusted death rate from 2014 to 2015 (p < 0.05).
NOTES: A total of 2,712,630 resident deaths were registered in the United States in 2015. The 10 leading causes accounted for 74.2% of all deaths in the United States in 2015. Causes of death are ranked according to number of deaths

What are the leading causes of infant death?

The infant mortality rate (IMR)—the ratio of infant deaths to live births in a given year—is generally regarded as a good indicator of the overall health of a population. The IMR changed from 582.1 infant deaths per 100,000 live births in 2014 to 589.5 in 2015, but this change was not statistically significant.
The 10 leading causes of infant death in 2015 accounted for 68.6% of all infant deaths in the United States. The leading causes remained the same as in 2014, although two causes exchanged ranks (Figure 4). The IMR for unintentional injuries increased 11.3% from 29.1 infant deaths per 100,000 live births in 2014 to 32.4 in 2015. Mortality rates for other leading causes of infant death did not change significantly.

Figure 4. Infant mortality rates for all causes and the 10 leading causes of infant death in 2015: United States, 2014 and 2015
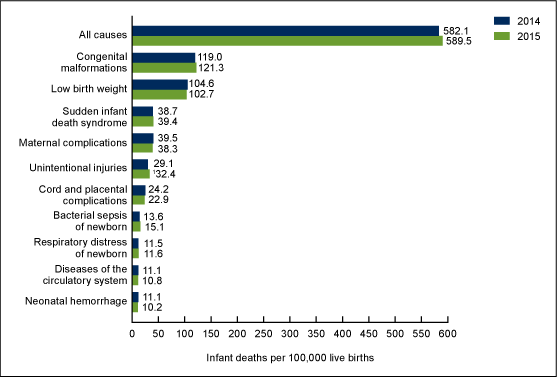
1Statistically significant increase in mortality rate from 2014 to 2015 (< 0.05).
NOTES: A total of 23,455 deaths occurred in children under age 1 year in the United States in 2015, with an infant mortality rate of 589.5 infant deaths per 100,000 live births. The 10 leading causes of infant death in 2015 accounted for 68.6% of all infant deaths in the United States. Causes of death are ranked according to number of deaths

Summary

In 2015, a total of 2,712,630 resident deaths were registered in the United States—86,212 more deaths than in 2014. From 2014 to 2015, the age-adjusted death rate for the total population increased 1.2%, and life expectancy at birth decreased 0.1 year. The age-adjusted death rate increased for non-Hispanic white males, non-Hispanic white females, and non-Hispanic black males. The rate for the total population rose significantly for the first time since 1999 .
The 10 leading causes of death in 2015 remained the same as in 2014. Age-adjusted death rates increased for eight leading causes. The only decrease in age-adjusted death rates among the 10 leading causes of death was for cancer. Life expectancy at birth decreased 0.1 year from 78.9 years in 2014 to 78.8 in 2015, largely because of increases in mortality from heart disease, chronic lower respiratory diseases, unintentional injuries, stroke, Alzheimer’s disease, diabetes, kidney disease, and suicide.
In 2015, a total of 23,455 deaths occurred in children under 1 year, which was 240 more infant deaths than in 2014. The leading causes of infant death were the same in 2015 as in 2014, although maternal complications, the third leading cause of infant death in 2014, became the fourth leading cause in 2015, while Sudden infant death syndrome, the fourth leading cause of infant death in 2014, became the third leading cause in 2015. The only significant change among the 10 leading causes of infant death was an 11.3% increase in the IMR for unintentional injuries.

Definitions

Cause-of-death: Based on medical information—including injury diagnoses and external causes of injury—that is entered on death certificates filed in the United States. This information is classified and coded in accordance with the International Statistical Classification of Diseases and Related Health Problems, Tenth Revision  (ICD-10).
Death rates: For 2015, based on population estimates for July 1, 2015, that are consistent with the April 1, 2010, census. These population estimates (as well as population figures for the 2010 census) are available on the National Center for Health Statistics’ (NCHS) website Age-adjusted death rates are useful when comparing different populations because they remove the potential bias that can occur when the populations being compared have different age structures. NCHS uses the direct method of standardization; see Technical Notes of “Deaths: Final Data for 2014” for more discussion.
Life expectancy: The expected average number of years of life remaining at a given age. It is denoted by e, which means the average number of subsequent years of life for someone now aged x. Life expectancy estimates for 2015 are based on a methodology first implemented with 2008 final mortality data (4). Life expectancies for 2014 were revised using updated Medicare data; therefore, figures may differ from those previously published.
Leading causes of death: Ranked according to the number of deaths assigned to rankable causes
Infant mortality rate (IMR): Computed by dividing the number of infant deaths in a calendar year by the number of live births registered for that same time period. IMR is the most widely used index for measuring the risk of dying during the first year of life.

Data source and methods

The data shown in this report reflect information collected by NCHS for 2014 and 2015 from death certificates filed in all 50 states and the District of Columbia and compiled into national data known as the National Vital Statistics System. Death rates shown in this report are calculated based on postcensal population estimates as of July 1, 2014, and July 1, 2015, which are consistent with the April 1, 2010, census. Differences between death rates were evaluated using a two-tailed z  test.

Wednesday, 21 October 2015

Designer antibodies may rid body of AIDS virus

Anti-HIV drugs have extended life for millions of people, but they have never eliminated the virus from anyone. That’s because HIV integrates its genetic material into the chromosomes of some white blood cells, helping it escape notice of the immune system. Two new studies show that artificial antibodies could “redirect” the immune response to these latently infected cells and help drain those HIV reservoirs in the body. But this creative strategy also carries risks.


“The rationale is sound, and the data are exciting, but we will need to move carefully,” says Steven Deeks, an HIV/AIDS clinician at the University of California, San Francisco (UCSF), who tests cure strategies. “There really is zero room for error.”

Several previous studies have explored whether drugs can shock cells that are infected with latent HIV to make new viruses, setting them up for the kill by the natural immune response. But this new work ups the ante by designing so-called bispecific antibodies that both promise to reverse latency and then do the mop-up work. “The dual activity makes this an attractive new approach,” says Sharon Lewin, a HIV cure researcher who directs the Peter Doherty Institute for Infection and Immunity in Melbourne, Australia. “It’s exciting.”

The two new papers, which only appear online so far, mainly involve test tube experiments. One, described in Nature Communications today, was conducted by a team from the Vaccine Research Center at the U.S. National Institute of Allergy and Infectious Diseases (NIAID) in Bethesda, Maryland. The second study appeared last month in The Journal of Clinical Investigation (JCI) and involved a collaboration between three universities and a biotech company.

Both groups designed artificial versions of antibodies, the Y-shaped molecules made by the immune system to target pathogens. With natural antibodies, both “arms” of the Y clasp the same target. But the arms of bispecific antibodies each grab a unique protein. In this case, both teams designed their antibodies to clasp an HIV protein and CD3, a receptor found on the surface of white blood cells.

The bispecific antibodies focus on the CD3 receptor for two reasons. One is that HIV hides its DNA inside white blood cells, or T lymphocytes, that have CD3 receptors. The other is that a second type of CD3-studded lymphocyte known as a killer T cell destroys HIV-infected cells.

The bispecific antibody first binds to CD3 on cells that harbor latent HIV. This prompts the cells to divide, an “activation” process that wakes up the sleeping virus. New HIV proteins are subsequently produced that migrate to the surface of the cell.

Now, the bispecific antibody grabs a killer T cell that has a CD3 receptor and, with its second arm, finds a recently activated cell that has HIV proteins on its surface. Bringing the killer T cell in close proximity to the infected cell effectively stuffs the prey into the lion’s mouth. “The molecule works just as you’d hope it would in several assays,” says John Mascola, director of NIAID’s Vaccine Research Center and head of the group reporting the Nature Communications study.

But neither team has yet shown that their bispecific antibodies can actually reduce reservoirs of HIV in monkeys, which are commonly used to study the AIDS virus. Those studies are underway, and it will take at least a year before either team tests the concepts in HIV-infected people. David Margolis, a virologist at the University of North Carolina, Chapel Hill, and co-author of the JCI study, says draining a reservoir ultimately may require combining bispecific antibodies with other latency reversing approaches and immune system stimulators like anti-HIV vaccines.

UCSF’s Deeks cautions that anti-CD3 antibodies can cause too much activation of T cells, leading to a massive inflammatory reaction that damages organs and can even cause death. Indeed, in one 1999 study of anti-CD3 antibodies used to purge reservoirs in three HIV-infected people.

Friday, 2 October 2015

Fat Rich Food during Pregnancy

Fat Rich Food during Pregnancy can Lead to Obesity in Children


A recent research report has concluded that intake of a fat rich food during pregnancy and lactation can potentially put a child at a higher risk of obesity in later life. Published in the Journal of Physiology, the report highlights that the reflex mechanism which otherwise keeps a check on the amount of food we eat, malfunctions in children due to fat-rich diet consumed during pregnancy. This reflex mechanism becomes less sensitive, ultimately resulting in obesity in later life.
As a part of the research, the researchers fed one group of rats high-fat diet during pregnancy and lactation. Their offspring were fed the same diet after they weaned off. As the rats reached adolescence, their neural activity involved in energy balance and appetite regulation was measured by the researchers. “We looked at the circuits that relay information from the stomach and the small intestine to the brain and back to the stomach telling it how to work,” said Kirsteen Browning, lead investigator and Associate Professor of neural and behavioural sciences at the Penn State College of Medicine. “We found that parts of these reflexes were actually compromised even before we saw obesity,” Browning added.
She mentioned that it is not a norm that all mothers who consumed fat-rich diet had obese children. Also, obese people may not necessarily have mothers who had a fat-rich diet while they were pregnant. “It is just one more risk factor. An understanding of the biological mechanisms underpinning obesity could help stem the tide of obesity,” she added.
She however stated that, “It is time that we start to take seriously the idea that obesity is, in part, a brain disease.”

Sunday, 9 August 2015

How to choose M.Pharm project


  How to choose M.Pharm project

Step 1: Select broad themes you are interested.


(1) The first thing you need to do is jot down the general themes what makes you interest in your subject area. If you are doing masters then think about what topics make you interested in your masters degree.


(2) Then think about ''HOT'' topics in your field. For this one you need to look for either in the research papers or in the popular journals like ''Science Direct'' or ''Pubmed''


(3) Look for popular discussions about your interested topic in discussion forums relevant to pharmacy profession.


 (4) Consider to think about your interests from your childhood and young age. So far you got some idea so what you need to do is take a pen and paper and write down your thoughts.


Step 2: What are particular things making you interest in those themes?

            This is the step you need to put little bit more effort, in fact it is for example: In the general theme if you got up with one or more questions need to be answer then consider them as separably and make the list of your interesting themes under those generalized them.  By doing this you come to know about the topics of your interest in the priority wish list.


Step 3: Ask questions about those topics of interest?

            So it is a time to think about asking questions yourself about the topics of interest. These questions you need investigate further in your project, think about these questions in details and try to think it's relevance to other topics of interest.

Step 4: Now it is a time to think about your research question viability.

            Once you have the questions of interest, try to think about it's sensibility and appropriateness about answering the question. Here 'Viability' is whether the project is manageable to do at your institute or not and the timeline required to do such a project. 


Step 5: Final choice be careful.

            After going through stage 4 several times, you will think about possible viable projects options. The last question but very important question ask yourself : Does the topic really exciting you or not?. For this question your answer need to be 'YES'. You need to be live up with this topic for few months or possibly for one year in case of postgraduate people and it requires 3 years for doctoral students. 


            We will discuss further analysis in terms of specific subject related projects  in the next post...If you have any doubts feel free to comment below the post.


Monday, 27 July 2015

Types of Doctors In English


Types of Doctors in English


DOCTOR/M.D. : a person who has a degree of Doctor of Medicine, works to help sick people, and is licensed to prescribe medicine

  When you are sick, you should see a doctor.


GENERAL PRACTIONER/G.P. : an M.D. who treats most common diseases and ailments

  Our G.P. takes care of the whole family in one visit.


PEDIATRICIAN : a specialist in children’s health

  As soon as the baby was born he was examined by a pediatrician.


DENTIST :a doctor who takes care of the teeth

  It’s a good idea to see a dentist at least once a year.


ORTHODONTIST: a dentist who specializes in straightening teeth

The orthodontist fixed her crooked teeth, and now she has a beautiful smile.


PERIODONTIST : a dentist who specializes in gums

The periodontist was able to help prevent gum recession in most patients.


DERMATOLOGIST : a skin specialist

A dermatologist can help you with your allergies.


E.N.T. / ear, nose, and throat doctor : a specialist for the ear, the nose, and the throat

She sees an E.N.T. for her sinusitis.


EYE DOCTOR/OPTHALMOLOGIST : a specialist for eyes

The ophthalmologist prescribed glasses for our son.


GASTROENTEROLOGIST: a stomach specialist

He is seeing a gastroenterologist to help cure his digestive problem.


GYNECOLOGIST : a specialist in women’s health

Many women are checked by a gynecologist once a year.


OBSTETRICIAN : a specialist in the delivery of babies

As soon as she suspected she was pregnant, she went to see an obstetrician.


ORTHOPEDIST : a specialist in bones

When he broke his leg, the orthopedist put it in a cast.


PODIATRIST: a specialist in feet

The podiatrist told her not to wear high-heeled shoes.


SURGEON : a specialist who performs major operations

The surgeon was in the operating room for four hours.

Saturday, 25 July 2015

Caution on three life saving drugs

IPC recommends caution on 3 life saving drugs in market to CDSCO based on ADRs

Indian Pharmacopeia Commission’s (IPCs) signal review panel recently submitted strategic recommendation to the Central Drugs Standard Control Organisation (CDSCO) on the 3 important life saving drugs running in the market. These reports were submitted based on the detailed observation made by the expert panel following the adverse drug reaction (ADR) report generated from different ADR centres across the country.

Based on the evaluation report received from different AMCs under the Pharmacovigilance Programme of India (PvPI), it was found that use of carbamazepine is associated to cause Stevens Johnson Syndrome (SJS) in some patients. Dr V Kalaiselvan, principal scientific officer from the Indian Pharmacopoeia Commission informed that considering the safety of the patients, the review panel recommended the CDSCO to direct all the manufacturers to insert a clear warning on its label on the possible side effects of the drug, to caution the patients.

It is understood that carbamazepine which is available in different brands like Carbatrol, Epitol, Equetro, TEGretol, TEGretol XR etc. is a commonly prescribed anticonvulsant drug for epilepsy, which works by decreasing nerve impulses that cause seizures and pain. It is also used to treat seizures and nerve pain such as trigeminal neuralgia and diabetic neuropathy along with treating bipolar disorder.

Dr Kalaiselvan further stated that this report has been submitted after extensively analysing and studying ADR reports generated from more than 100 ADR centres across the country. SJS is a clinical syndrome presumed to be a hypersensitivity reaction manifested initially with prodromal symptoms of fever, malaise and a sore throat. The prodromal phase is then followed in some days by an acute polymorphous dermatologic syndrome manifested as erythematous maculo-papular like lesions, target lesions, bullae, vesicles, involvement of at least two mucous membranes, conjunctivitis and an associated systemic toxic state.

“Considering the seriousness of this matter, the panel has suggested the DCGI to take the above requisite steps for public safety. Apart from carbamazepine, IPC has also submitted recommendation to the Centre on two anti cancer drugs sunitinib and pazopanib as well. Based on the panels observation it has recommended the CDSCO to closely monitor these two drugs as there have been several incidents of ADRs reported from the use of these drugs,” he stressed.

Sunitinib is used to treat gastrointestinal stromal tumours (GIST) that grows in the stomach, intestine (bowel), or esophagus tube that connects the throat with the stomach in people with tumours that were not treated successfully with imatinib or people who cannot take imatinib. It is also used to treat advanced renal cell carcinoma (RCC), a type of cancer that begins in the cells of the kidneys and treat pancreatic neuroendocrine tumours (pNET), a type of tumour that begins in certain cells of the pancreas in people with tumours that have worsened and cannot be treated with surgery.

While pazopanib is used to treat advanced RCC in adults, it works by slowing or stopping the spread of cancer cells.

These observations were made based on report collected from over 60 ADR centres across the country. Signal detection in pharmacovigilance comprises of selection of drug adverse reaction, preliminary assessment of available evidence and a follow up on how the signal develops.

Tuesday, 21 July 2015

The Night Before An Exam


The Night Before an Exam - What Should You Do? 


Exam Anxiety Tip 1: Be Prepared Early

The most common cause of exam anxiety is lack of preparation for the exam. Set up a study schedule at least three weeks before your first exam. You may find that you actually need to start studying very early due to other commitments. Planning ahead also assists you to avoid cramming which can be a major cause of exam anxiety.

Exam Anxiety Tip 2: Sleep Well

Regular sleep is one of the best ways to control stress. Getting up and going to bed each day at the same times ensures that your body and brain are getting the rest they need for optimal functioning. Students who follow a regular sleeping pattern have been shown to perform 30% better than students who stay up late or get up early to study.

Exam Anxiety Tip 3: Same Caffeine & Sugar Intake

Keep caffeine and sugar intake the same during exam time. Don’t increase or decrease the amount of coffee, tea or cola that you normally drink as your body and brain are accustomed to getting a certain amount. Keep things in your life as stable as possible, especially during exam time.

Exam Anxiety Tip 4: Learned Relaxed Breathing

When you display any symptoms of anxiety during studying or during the exam, use relaxed breathing to calm yourself. Take your attention away from the task and take a few slow breaths. Say to yourself, “calm and relaxed” as you exhale. Practice relaxed breathing before the exam.


Exam Anxiety Tip 5: Don’t Study the Night Before

Studying the night before an exam causes your anxiety level to increase. Unfortunately, it doesn’t decrease when you go to sleep. Reduce anxiety by taking the evening off to relax ”“ watch TV, see a movie, read a novel, etc.

Exam Anxiety Tip 6: Review Main Themes

If it causes you anxiety NOT to study the night before an exam, review the main themes of the course earlier in the day. Of course, that implies that you should have already studied well.

Exam Anxiety Tip 7: Have a Plan before the Exam

As part of your studying, think about how you will approach the exam, and what you will do when you run into trouble. Having a plan in place will assist you to worry less about failing, and help you to concentrate more on passing.

Exam Anxiety Tip 8: Aim to Do Your Best

Often, students start thinking negatively when things aren’t going well on an exam. This can lead to lower self-confidence and increased self-doubt. Recognize and turn off your negative internal dialogue. Focus on the task instead of on yourself. Do not try for perfection ”“ aim to do your very best.