Sunday, 10 January 2016

Omnigraft to Treat Diabetic Foot Ulcers

FDA Approves Omnigraft to Treat Diabetic Foot Ulcers


The U.S. Food and Drug Administration approved a new indication for the Integra Omnigraft Dermal Regeneration Matrix (Omnigraft) to treat certain diabetic foot ulcers. The matrix device, which is made of silicone, cow collagen, and shark cartilage, is placed over the ulcer and provides an environment for new skin and tissue to regenerate and heal the wound.
An estimated 29 million people in the United States have been diagnosed with diabetes, according to the Centers for Disease Control and Prevention, and about 25 percent of them will experience a foot ulcer during their lifetime. Chronic diabetic foot ulcers are associated with tissue and bone infections and result in 50,000 amputations each year.
“We are excited to see a new innovation in diabetes care with the potential to improve the number of foot ulcers that heal,” said William Maisel, M.D., M.P.H., acting director of the Office of Device Evaluation in the FDA’s Center for Devices and Radiological Health. “Healing of these painful and debilitating ulcers is essential for patients to resume walking and other daily activities.”
The FDA first approved Integra Dermal Regeneration Template (which the company now also calls Omnigraft) in 1996 for the treatment of life threatening burn injuries when the use of a patient’s own skin for a graft was not possible.  In 2002, Integra Dermal Regeneration Template was approved for a new indication to treat patients undergoing reconstructive surgery for burn scars when they cannot have skin grafts. Now, Omnigraft is approved to treat certain diabetic foot ulcers that last for longer than six weeks and do not involve exposure of the joint capsule, tendon or bone, when used in conjunction with standard diabetic ulcer care.
Omnigraft’s new indication is based on a clinical study that demonstrated that the matrix device improved ulcer healing compared to standard diabetic foot ulcer care, which includes cleaning and covering the wound with a surgical bandage and keeping weight off of the foot with the ulcer. In the study, 51 percent of patients treated with Omnigraft had healed ulcers after 16 weeks compared to 32 percent of patients treated with standard diabetic foot ulcer care alone.
Adverse events observed in the clinical trial included infections, increased pain, swelling, nausea, and new or worsening ulcers.
Omnigraft shouldnot be used in patients with allergies to cow (bovine) collagen or chondroitin (cartilage from any source) since serious allergic reactions may occur. Omnigraft should also not be used on infected wounds.
Omnigraft is manufactured by Integra LifeSciences Corporation of Plainsboro, New Jersey.

Friday, 8 January 2016

146 Reasons Why Sugar Is Ruining Your Body

146 Reasons Why Sugar Is Ruining Your Health

By  M.Mijjumaniyar B.sc, B pharmacy, (M.Pharmacy)

1. Sugar can suppress the immune system.

2. Sugar upsets the mineral relationships in the body.

3. Sugar can cause hyperactivity, anxiety, difficulty concentrating, and crankiness in children.

4. Sugar can produce a significant rise in triglycerides.

5. Sugar contributes to the reduction in defense against bacterial infection (infectious diseases).

6. Sugar causes a loss of tissue elasticity and function, the more sugar you eat the more elasticity and function you loose.

7. Sugar reduces high density lipoproteins.

8. Sugar leads to chromium deficiency.

9 Sugar leads to cancer of the ovaries.

10. Sugar can increase fasting levels of glucose.

11. Sugar causes copper deficiency.

12. Sugar interferes with absorption of calcium and magnesium.

13. Sugar can weaken eyesight.

14. Sugar raises the level of a neurotransmitters: dopamine, serotonin, and norepinephrine.

15. Sugar can cause hypoglycemia.

16. Sugar can produce an acidic digestive tract.

17. Sugar can cause a rapid rise of adrenaline levels in children.

18. Sugar malabsorption is frequent in patients with functional bowel disease.

19. Sugar can cause premature aging.

20. Sugar can lead to alcoholism.

21. Sugar can cause tooth decay.

22. Sugar contributes to obesity

23. High intake of sugar increases the risk of Crohn's disease, and ulcerative colitis.

24. Sugar can cause changes frequently found in person with gastric or duodenal ulcers.

25. Sugar can cause arthritis.

26. Sugar can cause asthma.

27. Sugar greatly assists the uncontrolled growth of Candida Albicans (yeast infections).

28. Sugar can cause gallstones.

29. Sugar can cause heart disease.

30. Sugar can cause appendicitis.

31. Sugar can cause multiple sclerosis.

32. Sugar can cause hemorrhoids.

33. Sugar can cause varicose veins.

34. Sugar can elevate glucose and insulin responses in oral contraceptive users.

35. Sugar can lead to periodontal disease.

36. Sugar can contribute to osteoporosis.

37. Sugar contributes to saliva acidity.

38. Sugar can cause a decrease in insulin sensitivity.

39. Sugar can lower the amount of Vitamin E (alpha-Tocopherol in the blood.

40. Sugar can decrease growth hormone.

41. Sugar can increase cholesterol.

42. Sugar can increase the systolic blood pressure.

43. Sugar can cause drowsiness and decreased activity in children.

44. High sugar intake increases advanced glycation end products (AGEs)(Sugar bound non-enzymatically to protein)

45. Sugar can interfere with the absorption of protein.

46. Sugar causes food allergies.

47. Sugar can contribute to diabetes.

48. Sugar can cause toxemia during pregnancy.

49. Sugar can contribute to eczema in children.

50. Sugar can cause cardiovascular disease.

51. Sugar can impair the structure of DNA

52. Sugar can change the structure of protein.

53. Sugar can make our skin age by changing the structure of collagen.

54. Sugar can cause cataracts.

55. Sugar can cause emphysema.

56. Sugar can cause atherosclerosis.

57. Sugar can promote an elevation of low density lipoproteins (LDL).

58. High sugar intake can impair the physiological homeostasis of many systems in the body.

59. Sugar lowers the enzymes ability to function.

60. Sugar intake is higher in people with Parkinson’s disease.

61. Sugar can cause a permanent altering the way the proteins act in the body.

62. Sugar can increase the size of the liver by making the liver cells divide.

63. Sugar can increase the amount of liver fat.

64. Sugar can increase kidney size and produce pathological changes in the kidney.

65. Sugar can damage the pancreas.

66. Sugar can increase the body's fluid retention.

67. Sugar is enemy #1 of the bowel movement.

68. Sugar can cause myopia (nearsightedness).

69. Sugar can compromise the lining of the capillaries.

70. Sugar can make the tendons more brittle.

71. Sugar can cause headaches, including migraine.

72. Sugar plays a role in pancreatic cancer in women.

73. Sugar can adversely affect school children's grades and cause learning disorders..

74. Sugar can cause an increase in delta, alpha, and theta brain waves.

75. Sugar can cause depression.

76. Sugar increases the risk of gastric cancer.

77. Sugar and cause dyspepsia (indigestion).

78. Sugar can increase your risk of getting gout.

79. Sugar can increase the levels of glucose in an oral glucose tolerance test over the ingestion of complex carbohydrates.

80. Sugar can increase the insulin responses in humans consuming high-sugar diets compared to low sugar diets.

81 High refined sugar diet reduces learning capacity.

82. Sugar can cause less effective functioning of two blood proteins, albumin, and lipoproteins, which may reduce the body’s ability to handle fat and cholesterol.

83. Sugar can contribute to Alzheimer’s disease.

84. Sugar can cause platelet adhesiveness.

85. Sugar can cause hormonal imbalance; some hormones become underactive and others become overactive.

86. Sugar can lead to the formation of kidney stones.

87. Sugar can lead to the hypothalamus to become highly sensitive to a large variety of stimuli.

88. Sugar can lead to dizziness.

89. Diets high in sugar can cause free radicals and oxidative stress.

90. High sucrose diets of subjects with peripheral vascular disease significantly increases platelet adhesion.

91. High sugar diet can lead to biliary tract cancer.

92. Sugar feeds cancer.

93. High sugar consumption of pregnant adolescents is associated with a twofold increased risk for delivering a small-for-gestational-age (SGA) infant.

94. High sugar consumption can lead to substantial decrease in gestation duration among adolescents.

95. Sugar slows food's travel time through the gastrointestinal tract.

96. Sugar increases the concentration of bile acids in stools and bacterial enzymes in the colon. This can modify bile to produce cancer-causing compounds and colon cancer.

97. Sugar increases estradiol (the most potent form of naturally occurring estrogen) in men.

98. Sugar combines and destroys phosphatase, an enzyme, which makes the process of digestion more difficult.

99. Sugar can be a risk factor of gallbladder cancer.

100. Sugar is an addictive substance.

101. Sugar can be intoxicating, similar to alcohol.

102. Sugar can exacerbate PMS.

103. Sugar given to premature babies can affect the amount of carbon dioxide they produce.

104. Decrease in sugar intake can increase emotional stability.

105. The body changes sugar into 2 to 5 times more fat in the bloodstream than it does starch.

106. The rapid absorption of sugar promotes excessive food intake in obese subjects.

107. Sugar can worsen the symptoms of children with attention deficit hyperactivity disorder (ADHD).

108. Sugar adversely affects urinary electrolyte composition.

109. Sugar can slow down the ability of the adrenal glands to function.

110. Sugar has the potential of inducing abnormal metabolic processes in a normal healthy individual and to promote chronic degenerative diseases.

111.. I.Vs (intravenous feedings) of sugar water can cut off oxygen to the brain.

112. High sucrose intake could be an important risk factor in lung cancer.

113. Sugar increases the risk of polio.

114. High sugar intake can cause epileptic seizures.

115. Sugar causes high blood pressure in obese people.

116. In Intensive Care Units, limiting sugar saves lives.

117. Sugar may induce cell death.

118. Sugar can increase the amount of food that you eat.

119. In juvenile rehabilitation camps, when children were put on a low sugar diet, there was a 44% drop in antisocial behavior.

120. Sugar can lead to prostrate cancer.

121. Sugar dehydrates newborns.

122. Sugar increases the estradiol in young men.

123. Sugar can cause low birth weight babies.

124. Greater consumption of refined sugar is associated with a worse outcome of schizophrenia

125. Sugar can raise homocysteine levels in the blood stream.

126. Sweet food items increase the risk of breast cancer.

127. Sugar is a risk factor in cancer of the small intestine.

128. Sugar may cause laryngeal cancer.

129. Sugar induces salt and water retention.

130. Sugar may contribute to mild memory loss.

131. As sugar increases in the diet of 10 years olds, there is a linear decrease in the intake of many essential nutrients.

132. Sugar can increase the total amount of food consumed.

133. Exposing a newborn to sugar results in a heightened preference for sucrose relative to water at 6 months and 2 years of age.

134. Sugar causes constipation.

135. Sugar causes varicous veins.

136. Sugar can cause brain decay in prediabetic and diabetic women.

137. Sugar can increase the risk of stomach cancer.

138. Sugar can cause metabolic syndrome.

139. Sugar ingestion by pregnant women increases neural tube defects in embryos.

140. Sugar can be a factor in asthma.

141. The higher the sugar consumption the more chances of getting irritable bowel syndrome.

142. Sugar could affect central reward systems.

143. Sugar can cause cancer of the rectum.

144. Sugar can cause endometrial cancer.

145. Sugar can cause renal (kidney) cell carcinoma.

146. Sugar can cause liver tumors.

Sunday, 13 December 2015

Women can navigate better when given testosterone

Women can navigate better when given testosterone, study finds
Wait… what?

It's long been known that men fare better than women when it comes to performing some spatial recognition tasks such as navigating – although male readers are advised it may not always be prudent to share this information with their female partners (especially when arguing over the best way to get somewhere).

But why is this so? To investigate whether the differences in how men and women navigate are related to our sex or to cultural conditioning, researchers in Norway measured male and female brain activity while volunteers tried to find their way through a virtual reality maze.

Wearing 3D goggles and using a joystick to make their way through an artificial environment, the participants (18 males and 18 females) had their brain functions continuously recorded by an fMRI scanner as they carried out virtual navigation tasks.

In line with previous findings, the men performed better, using shortcuts, orienting themselves more using cardinal directions, and solving 50 percent more tasks than the women in the study.


"Men's sense of direction was more effective," said Carl Pintzka, a neuroscientist at the Norwegian University of Science and Technology (NTNU). "They quite simply got to their destination faster."

One of the reasons for this is because of the difference in how men and women use their brains when we're finding our way around. According to the researchers, men use the hippocampus more, whereas women place greater reliance on their brains' frontal areas.

"That's in sync with the fact that the hippocampus is necessary to make use of cardinal directions," said Pintzka. "[M]en usually go in the general direction where [their destination is] located. Women usually orient themselves along a route to get there."

Generally, the cardinal approach is more efficient, as it depends less on where you start.

But women's brains make them better at finding objects locally, the researchers say. "In ancient times, men were hunters and women were gatherers. Therefore, our brains probably evolved differently," said Pintzka. "In simple terms, women are faster at finding things in the house, and men are faster at finding the house."

What was most remarkable about the study was what happened when the researchers gave women a drop of testosterone to see how it affected their ability to navigate the virtual maze. In a separate experiment, 21 women received a drop of testosterone under their tongues, while 21 got a placebo.

The researchers found that the women receiving testosterone showed improved knowledge of the layout of the maze, and relied on their hippocampus more to find their way around. Having said that, these hormone-derived benefits didn't enable them to solve more maze tasks in the exercise.

It's worth bearing in mind that the study used a fairly small sample size in both of the experiments carried out, so the findings need to be read in light of that. Nonetheless, the scientists believe their paper, which is published in Behavioural Brain Research, will help us to better understand the different ways male and female brains work, which could assist in the fight against diseases such as Alzheimer's.

"Almost all brain-related diseases are different in men and women, either in the number of affected individuals or in severity," said Pintzka. "Therefore, something is likely protecting or harming people of one sex. Since we know that twice as many women as men are diagnosed with Alzheimer's disease, there might be something related to sex hormones that is harmful."

Friday, 11 December 2015

Pain killer ibuprofen now in Patch

New Ibuprofen Patch Offers Consistent Pain Relief For Up To 12 Hours
Ibuprofen is the go-to medicine for many people looking to relieve pain. For some of these people, however, swallowing the little orange pills is a dreaded task. Working in collaboration with Medherant, a bioadhesives company, researchers from the University of Warwick (UW) sought to remedy this issue. So they created an ibuprofen-releasing patch capable of delivering a concentrated dose directly through the skin.


“Many commercial patches surprisingly don’t contain any pain relief agents at all, they simply soothe the body by a warming effect,” UW research chemist Professor David Haddleton said in a press release. “Our technology now means that we can for the first time produce patches that contain effective doses of active ingredients, such as ibuprofen, for which no patches currently exist. Also, we can improve the drug loading and stickiness of patches containing other active ingredients to improve patient comfort and outcome.”

Unlike traditional oral ibuprofen pills that dissolve in the stomach and immediately get to work, the patch releases a steady stream of pain relief over the course of 12 hours. The researchers believe this will open up a whole realm of possibilities for over-the-counter analgesic products that will help soothe back pain, nerve pain, and arthritis.

The patch uses a polymer technology to stick to the skin for the total time it takes to deploy its drug load — the ratio of the active drug to total content of the patch. The researchers say the drug load can be five to 10 times higher than that of traditional patches and gels, meaning it outperforms competition when it comes to drug delivery. What’s more, they say the patch can be easily removed without leaving residue, and that it’s “aesthetically pleasing,” too.

The researchers believe the technology behind the patch has a variety of uses as well. “Our transdermal patch technology expands the range of drugs that can be delivered via skin patches, and can significantly increase drug loading capabilities, while retaining adhesion and being thin and flexible,” Medherant CEO Nigel Davis said in the release. “Thus our patches provide a better experience for patients, enhance safety, and deliver increased efficacy, which will lead to economic benefits to the health care system.”

The patch could benefit the more than 30 million Americans who use NSAIDs — which include ibuprofen, aspirin, and acetaminophen — to quell everything from headaches to arthritis. First, however, it most likely have to be tested for effectiveness and safety. If it's proven to work, Haddleton and his team believe it will be available for over-the-counter use within the next two years.

Sunday, 6 December 2015

The best moments in Doctor 's life

Best Moments In a Doctor's Life.

1. The sound of restarting heartbeats when resuscitating a patient.
2. Closure after a difficult surgery where only the surgeon knows how he / she has saved a life.
3. A perfect surgery / procedure / stenting without complication.
4. Seeing the beautiful cute face of a healthy newborn.
5. Managing a major bleeder successfully.
6. Reversal of paralysis after thrombolysis (clot-buster injection).
7. Termination of Status Epilepticus (non-stop seizures/ convulsions).
8. Control over infection. Every infection is life threatening potentially.
9. Waking up of a comatose patient.
10. The genuine “Thank You” of a patient relieved of pain / stress / illness.
11. When someone random recognizes you in public and thanks you in front of your kids / family.
12. When the poorest of the poor collect enough money and gift you sweets for treating them free.
13. When a patient too educated to believe your truth goes to your professional competitors and many others, and is told the same, so returns to you with a greater faith.


14. When you can answer all questions asked by students after a lecture / clinic (without Herapheri / bluffing).
15. When a student performs well and patient gives a good feedback about them.
16. When you silently prove your clinical argument with good results.
17. When anyone at work says “Take some rest now.. You have been working too much”.


18. Qualifying for a medal/degree/publication of significant repute.
19. When you know that it’s not only the medical skills, but also your passionate involvement, speed and coordination that saved the patient.
20. When traffic police “Let you go” for minor offences just because you are a doctor, especially on the way to an emergency.
21. When someone says “I want to become a Doctor like you”.

There are many more. Every day is filled with both tears and smiles, and the doctor has to balance these by using his/her soul as the fulcrum. At the end of the day, death humbles everyone, but it is the doctor who stands to defend everyone else’s life without thinking if they are good or bad, friend or enemy.

Who will believe that money, home, family, cars, looks, luxury, and even love, romance are secondary joys for most doctors, after they have attended all their patient’s issues?

This pride is precious. The suffering a choice.The rewards immaterial.

A good doctor is the best a human being can be.

Saturday, 14 November 2015

socioeconomic position

Definitions

The National Center for HIV/AIDS, Viral Hepatitis, STD, and TB Prevention uses the words below to describe health equity and social determinants of health. These words are also used by the World Health Organization and the Department of Health and Human Service's Healthy People 2020.

Absolute Difference of Measure

A mathematical formula that measures "disparity between a group rate and a specified reference point." "The size and direction of the disparity depend on the selected reference point".
Formula: Simple difference = rate of interest – rate of reference point = Ri – Rr

Cultural Competence

Culture is the blended patterns of human behavior that include "language, thoughts, communications, actions, customs, beliefs, values, and institutions of racial, ethnic, religious, or social groups." Cultural competence is "a set of congruent behaviors, attitudes, and policies that come together in a system, agency, or among professionals that enables effective work in cross-cultural situations." "Competence" in the term cultural competence implies that an individual or organization has the capacity to function effectively "within the context of the cultural beliefs, behaviors, and needs presented by consumers and their communities." 

Determinants of Health

Factors that contribute to a person's current state of health. These factors may be biological, socioeconomic, psychosocial, behavioral, or social in nature. Scientists generally recognize five determinants of health of a population:
  • Biology and genetics. Examples: sex and age
  • Individual behavior. Examples: alcohol use, injection drug use (needles), unprotected sex, and smoking
  • Social environment. Examples: discrimination, income, and gender
  • Physical environment. Examples: where a person lives and crowding conditions
  • Health services. Examples: Access to quality health care and having or not having health insurance

Health

A state of complete physical, mental, and social well-being and not just the absence of sickness or frailty 

Health Disparity

A type of difference in health that is closely linked with social or economic disadvantage. Health disparities negatively affect groups of people who have systematically experienced greater social or economic obstacles to health. These obstacles stem from characteristics historically linked to discrimination or exclusion such as race or ethnicity, religion, socioeconomic status, gender, mental health, sexual orientation, or geographic location. Other characteristics include cognitive, sensory, or physical disability.

Health Equity

When all people have "the opportunity to 'attain their full health potential' and no one is 'disadvantaged from achieving this potential because of their social position or other socially determined circumstance'

Health Inequality

Differences, variations, and disparities in the health achievements of individuals and groups of people.

Health Inequity

A difference or disparity in health outcomes that is systematic, avoidable, and unjust .

Health Literacy

Whether a person can obtain, process, and understand basic health information and services that are needed to make suitable health decisions. Health literacy includes the ability to understand instructions on prescription drug bottles, appointment cards, medical education brochures, doctor's directions, and consent forms. It also includes the ability to navigate complex health care systems. Health literacy is not simply the ability to read. It requires a complex group of reading, listening, analytical, and decision-making skills and the ability to apply these skills to health situations.

Index of Disparity

A regression-based measure that is used by scientists and retains the inherent order of categories like education or income but incorporates the population weights of the categories. The size of each category is taken into account by placing the groups on an axis that reflects the cumulative proportion of the population represented by the ordered groups. The index of disparity can be absolute (slope referred to as Slope Index of Inequality) or relative (slope referred to as Relative Index of Inequality)

Individual Risk Factors

Characteristics of a person that may explain health or behavior. Some examples include a person's age or whether a person smokes.
Poverty
When a person or group of people lack human needs because they cannot afford them. Human needs include clean water, nutrition, health care, education, clothing, and shelter. The U.S. Social Security Administration originally developed the definitions that are used to help calculate and determine poverty. Families or people with income below a certain limit are considered to be below the poverty level.

Social Determinants of Health

The complex, integrated, and overlapping social structures and economic systems that are responsible for most health inequities. These social structures and economic systems include the social environment, physical environment, health services, and structural and societal factors. Social determinants of health are shaped by the distribution of money, power, and resources throughout local communities, nations, and the world.

Socioeconomic Gradient in Health

This term refers to the stepwise fashion health outcomes improve as socioeconomic position improves. This gradient can be measured by a person's income, occupation, or the highest level of education he or she has.

Socioeconomic Position

An aggregate concept that includes both resource-based and prestige-based measures, which are linked to both childhood and adult social class position. Resource-based measures refer to material and social resources and assets, including income, wealth, and educational credentials. Terms used to describe inadequate resources include "poverty" and "deprivation." Prestige-based measures refer to a person's rank or status in a social hierarchy. Prestige-based measures are typically evaluated with reference to people's access to and consumption of goods, services, and knowledge, that are linked to their occupational prestige, income, and education level 

Socioeconomic Status

A composite measure that typically incorporates economic, social, and work status. Economic status is measured by income. Social status is measured by education, and work status is measured by occupation. Each status is considered an indicator. These three indicators are related but do not overlap.

Births in the United States, 2016

Key findings

Data from the National Vital Statistics System
  • The U.S. general fertility rate declined to 62.0 births per 1,000 women aged 15–44 in 2016, down 1% from 2015.
  • Birth rates declined among women under age 30 in 2016, and rose for women aged 30–44.
  • The cesarean delivery rate continued to decline in 2016, down to 31.9% of all births.
  • The preterm birth rate rose for the second straight year to 9.85% in 2016.
  • The 2016 rate of triplet and higher-order multiple births was 48% lower than the 1998 peak.
This report presents several key demographic and maternal and infant health indicators using 2016 final birth data. Trends in the general fertility rate (the number of births per 1,000 women aged 15–44), age-specific birth rates, cesarean delivery, preterm, and triplet and higher-order multiple birth rates are presented by age of mother. For each indicator, data for 2016 are compared with 2015, and also with a year representing a recent high or low rate.

Birth rates for women under age 30 declined in 2016, whereas rates for women 30 and over rose.

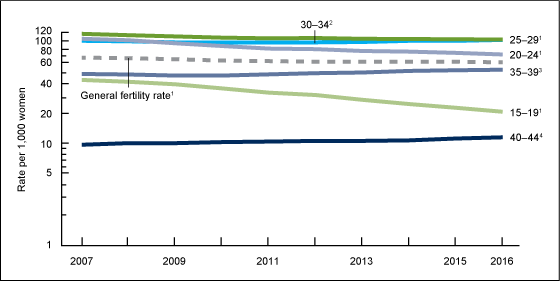
  • The general fertility rate declined 1% in 2016, to 62.0 births per 1,000 women aged 15–44. The rate is down 11% since 2007, the most recent high (Figure 1).
  • The birth rate for teens aged 15–19 declined 9% from 2015 to 2016, to 20.3 births per 1,000 women. The rate has declined 51% since 2007.
  • Birth rates for women in their twenties declined from 2015 to 2016, down 4% for women aged 20–24 (to 73.8 per 1,000 births) and 2% for women aged 25–29 (to 102.1).
  • Birth rates for women in their thirties and early forties rose from 2015 to 2016, up 1% for women aged 30–34 (to 102.7), 2% for women aged 35–39 (to 52.7), and 4% for women aged 40–44 (to 11.4). Since 2007, the rate has risen 19% for women in their early forties, 2% for women in their early thirties, and 11% for women in their late thirties.
    • Figure 1. General fertility and age-specific birth rates, by age of mother: United States, 2007–2016
 Figure 1 is a line chart showing the general fertility rate and age-specific birth rates in the United States from 2007 through 2016.
  Significant decreasing trend for 2007–2016 (p < 0.05).
 Significant decreasing trend for 2007–2011; significant increasing trend for 2011–2016 (p < 0.05).
 Significant decreasing trend for 2007–2010; significant increasing trend for 2010–2016 (p < 0.05).
Significant increasing trend for 2007–2016 (p < 0.05).

NOTES: Rates are plotted on a logarithmic scale. The general fertility rate is the number of births per 1,000 women aged 15–44; the age-specific birth rate is the number of births per 1,000 women in the specified age group.

The cesarean delivery rate dropped below 32% in 2016.

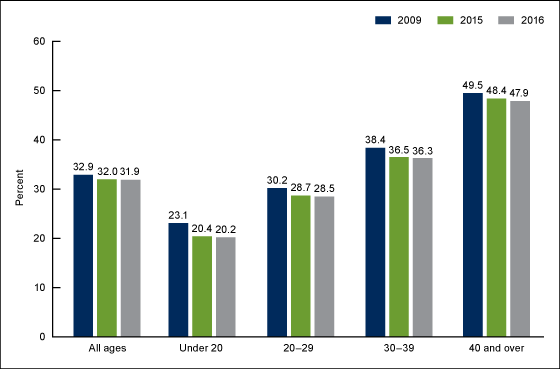
  • The cesarean delivery rate declined to 31.9% in 2016, from 32.0% in 2015. The rate is down 3% from the peak of 32.9% in 2009 (Figure 2).
  • Cesarean delivery rates decreased slightly (about 1%) from 2015 to 2016 for all maternal age groups.
  • In 2016, rates were down 13.0% for mothers aged 20 and under (to 20.2), 6% for those aged 20–29 (28.5%), 5% for those aged 30–39 (36.3%), and 3% for women aged 40 and over (47.9%) from the 2009 peaks.
    • Figure 2. Cesarean delivery rates, by age of mother: United States, 2009, 2015, and 2016
Figure 2 is a bar chart showing cesarean delivery rates by age of mother for the United States for 2009, 2015, and 2016.

NOTES: Significant differences in rates for all years for all age groups (p < 0.05

The preterm birth rate rose for the second straight year in 2016.

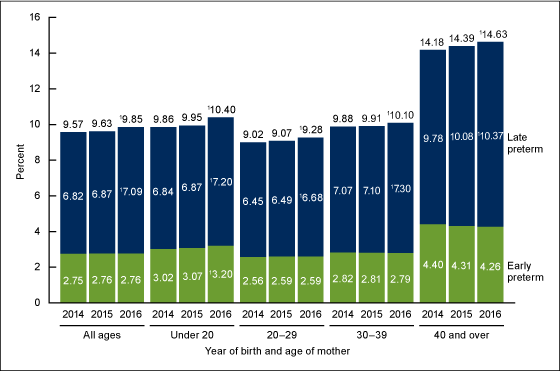
  • The preterm birth rate rose 2% in 2016 to 9.85%, from 9.63% in 2015, continuing the increase observed from 2014 (9.57% and a recent low) to 2015 (Figure 3).
  • Most of the increase from 2014 to 2016 was among infants born late preterm, up 4% from 2014 to 2016 (6.82% to 7.09%). The early preterm birth rate was essentially unchanged (2.76% in 2016).
  • Increases in late preterm birth rates occurred among all age groups from 2015 to 2016 and from 2014 to 2016. For 2014–2016, late preterm rates rose 5% for births to women under age 20, 4% for births to women in their twenties, 3% for births to women in their thirties, and 6% for births to women aged 40 and over.
    • Figure 3. Preterm birth rates, by age of mother: United States, 2014–2016
  • Figure 3 is a bar chart showing preterm birth rates by age of mother in the United States for 2014, 2015, through 2016.
Significant increasing trend (p < 0.05).

NOTES: Figures may not equal totals due to rounding

Triplet and higher-order multiple births continued to decline in 2016.

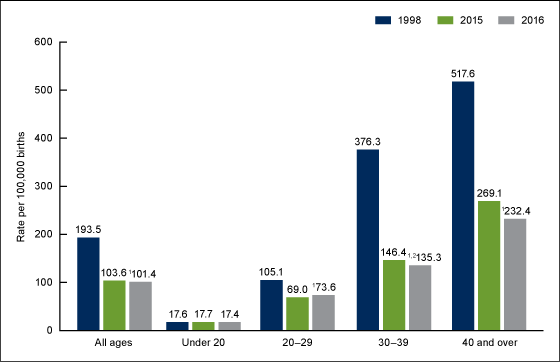
  • The 2016 rate of triplet and higher-order multiple births was 101.4 per 100,000 total births, a non-statistically significant decline from 2015 (103.6). The 2016 rate declined 48%, to nearly one-half of the 1998 peak, 193.5 per 100,000 (Figure 4).
  • Declines in triplet and higher-order multiple birth rates were seen for each group aged 20 and over from 1998–2016, with the largest declines among women aged 30–39 (down 64%) and women aged 40 and over (down 55%).
  • For 2015–2016, the rate declined significantly for women aged 30–39 (from 146.4 to 135.3 per 100,000); changes for other age groups were not statistically significant.

Figure 4. Triplet and higher-order multiple birth rates, by age of mother: United States, 1998, 2015, and 2016
Figure 4 is a bar chart showing triplet and higher-order multiple birth rates by age of mother in the United States for 1998, 2015, and 2016.
1Significant difference in rate from 1998 (p < 0.05).
2Significant difference in rate from 2015 (p < 0.05).
NOTE: Access data table for Figure 4.

Summary

Birth certificate data for the United States in 2016 show a continuation of recent trends for several key natality measures. The general fertility rate continued to fall, with record lows in teen childbearing and for women in their twenties . In contrast, rates for older women continued to rise, resulting in a higher birth rate for women aged 30–34 than for women aged 25–29 for the first time since 1940 when these data became available . The cesarean delivery rate declined 3% from the record high in 2009 and was under 32% in 2016 for the first year in a decade (31.8% in 2007) . The rate for triplet and higher-order multiple births has been on the decline since 1998, the record highest year for this rate, and was the lowest in more than two decades (since 1992) . For both measures, declines were observed for most or all age groups. The rate of preterm birth had been on the decline in the United States (from 10.44% in 2007 to 9.57% in 2014) . Although the recent upturn in the preterm birth rate is of shorter duration (2014–2016) than the other measures presented in this report, it is of concern—infants born prior to full term (39–40 completed weeks of gestation) are at higher risk of morbidity and mortality than those born at a later gestational age . Provisional data indicate an extension of the upward trend in this rate through the first quarter of 2017.

Definitions

General fertility rate: Number of births per 1,000 women aged 15–44.
Age-specific birth rate: Number of births per 1,000 women in the specified age group.
Cesarean delivery rate: Number of births delivered by cesarean per 100 births.
Preterm birth rate: Number of births delivered before 37 completed weeks of gestation per 100 births. Gestational age is based on the obstetric estimate of gestation.
Early preterm birth rate: Number of births delivered before 34 completed weeks of gestation per 100 births.
Late preterm birth rate: Number of births delivered at 34–36 completed weeks of gestation per 100 births.
Triplet/+ birth rate: Number of triplet and higher-order multiple births per 100,000 total births.

Data source and methods

This report is based on data from the Natality Data File from the National Vital Statistics System (NVSS). The vital statistics natality file is based on information derived from birth certificates and includes information for all births occurring in the United States. This data brief accompanies the release of the 2016 natality public-use file . A more detailed analysis of the topics presented in this report and many others, including births to unmarried women, prenatal care, tobacco use during pregnancy, source of payment for delivery, pregnancy risk factors, receipt of Women, Infants, and Children (WIC) food, maternal morbidity, and breastfeeding, is possible by using the annual natality files . Data are not presented separately in this report for women aged 15 and under or age 45 and over. For 2016 information on these age groups, see “Births: Provisional Data for 2016”.
References to increases or decreases in rates or percentages indicate that differences are statistically significant at the 0.05 level. Trends in rates for (Figure 1) were evaluated using the Joinpoint Regression Program. Trends in rates for (Figures 2–4) were assessed using the Cochran-Armitage test for trends, a modified Chi-squared test. Computations exclude records for which information is unknown.